RESULT
+57% revenue per customer from landing pages, at the same CPA
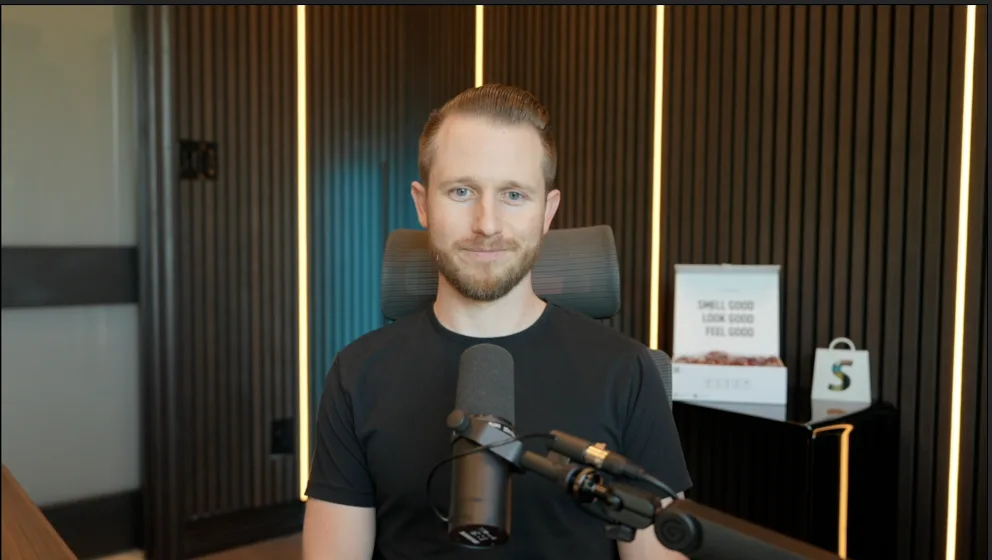

 Laundry SauceIan Blair (Founder & CEO) · 8-figure US Laundry Pod Brand
FOR 7-9 FIGURE ECOMMERCE BRANDS
LPG Digital builds and A/B tests the pages that decide your revenue — PDP, cart, homepage and landing pages — so the traffic you already pay for comes back worth more.
TRUSTED BY 40+ 7–9 FIGURE ECOMMERCE BRANDS
















 Inka Arthouse
FOUR QUESTIONS · UNDER A MINUTE
Answer four questions, then pick a time. On the call we look at your funnel, name the biggest leak and tell you what we would test first.
Qualified for a Guaranteed Lift
+$392K YoY on Black Friday Sales Day #1
“Your calmness under pressure and ability to pinpoint high-impact changes so quickly made a real difference.”
 Steph PryorMontiiCo
+AU$4.1M ARR
“My CVR has officially gone from 2.5% to almost 6%. This is a game changer for my business.”
 Grace GentilliCouchCare
+$9.6M ARR
“Eye-opening. I was genuinely impressed with how quickly he identified opportunities for improvement, with confidence.”
 Arny PollackSeat Cover Solutions

Founder · LPG Digital
Lars led conversion-rate optimization for Nike.com and the Nike app for eight and a half years, alongside consulting 12 9-figure Nike partner brands on their UX. He founded LPG Digital to put that same enterprise-grade strategy in front of DTC brands.
OUR SOFTWARE PARTNERS
 heatmap.comRevenue-attributed heatmaps
 Elevate A/BShopify A/B testing
 VarifyA/B testing platform
 HiveEcommerce operations
THE RECEIPTS
Every result below comes from the client’s own store data. No estimates, no projections.
+57% revenue per customer from landing pages, at the same CPA
Laundry SauceIan Blair (Founder & CEO) · 8-figure US Laundry Pod BrandWelcome offer + PDP redesign: subscriptions went from 50% to 96% of orders, and a record revenue month
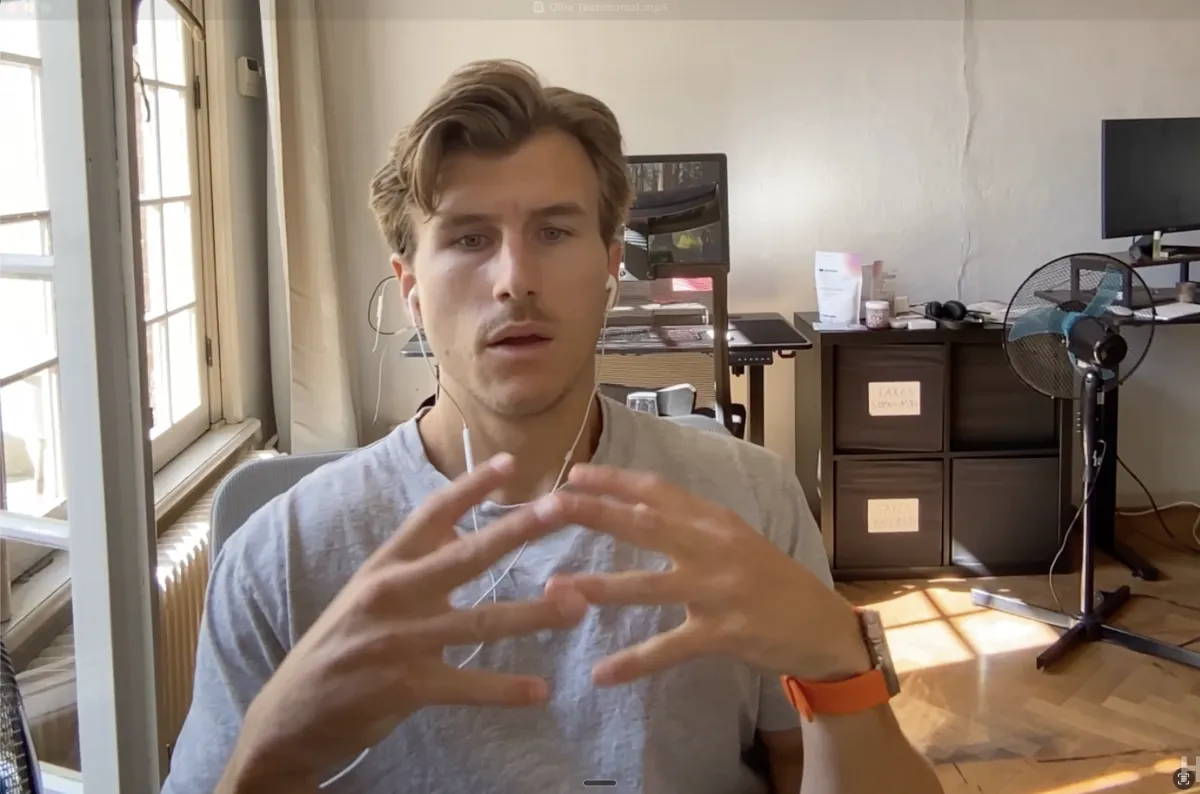
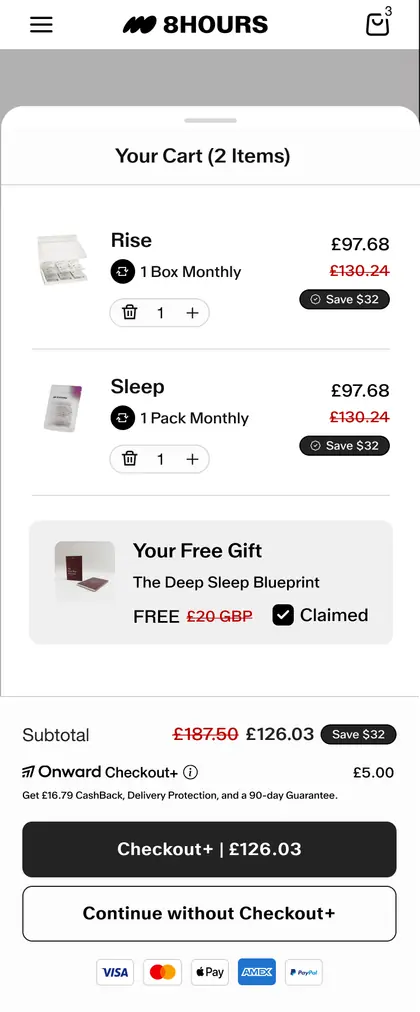
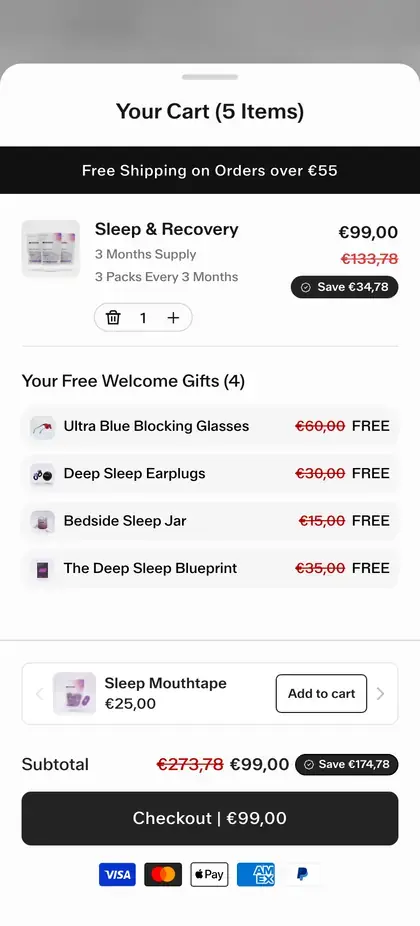
 8 HoursOliver Groombridge (Co-Founder) · 7-figure EU Sleep Supplement Brand
PDP redesign: +25% revenue per visitor

 Next Level SkinNel Moktar (Founder & CEO) · 7-figure AU Beauty Brand
PDP redesign: +29% revenue per visitor, +25% conversion rate
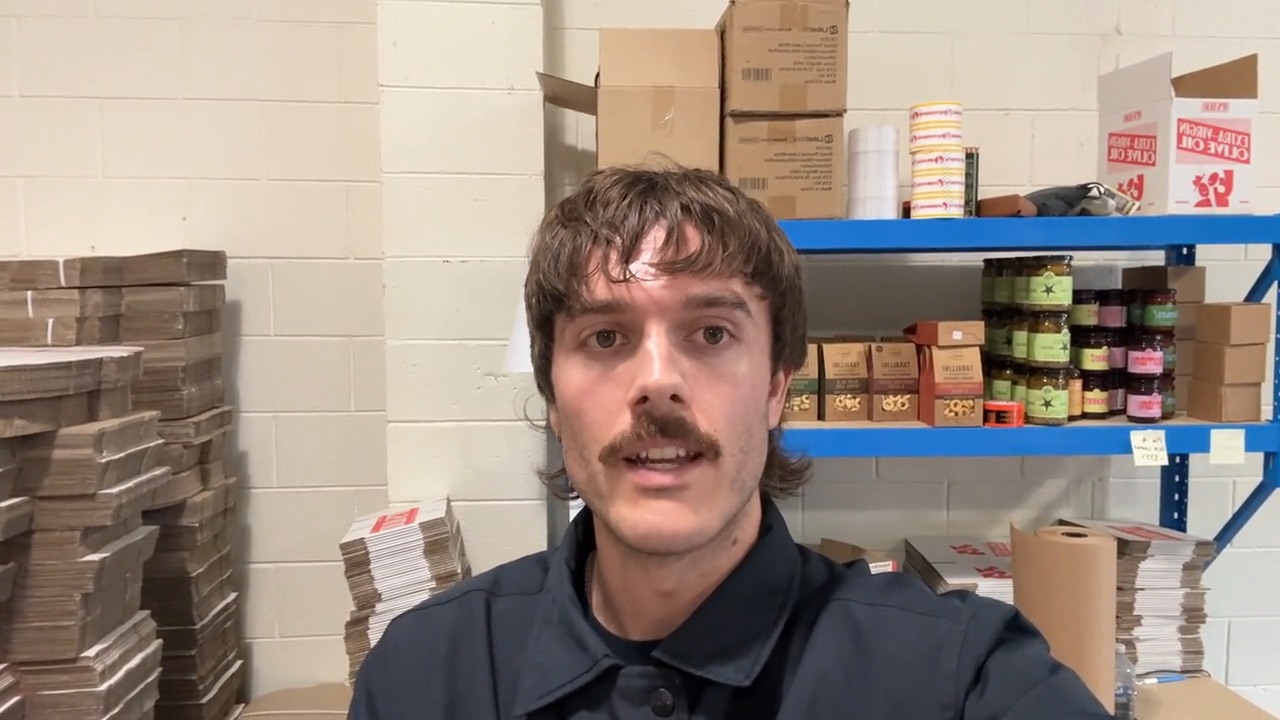
 It’s OlioAlec Randall · 7-figure AU Olive Oil Brand
PDP redesign: +21% revenue per visitor, +53% add-to-cart rate
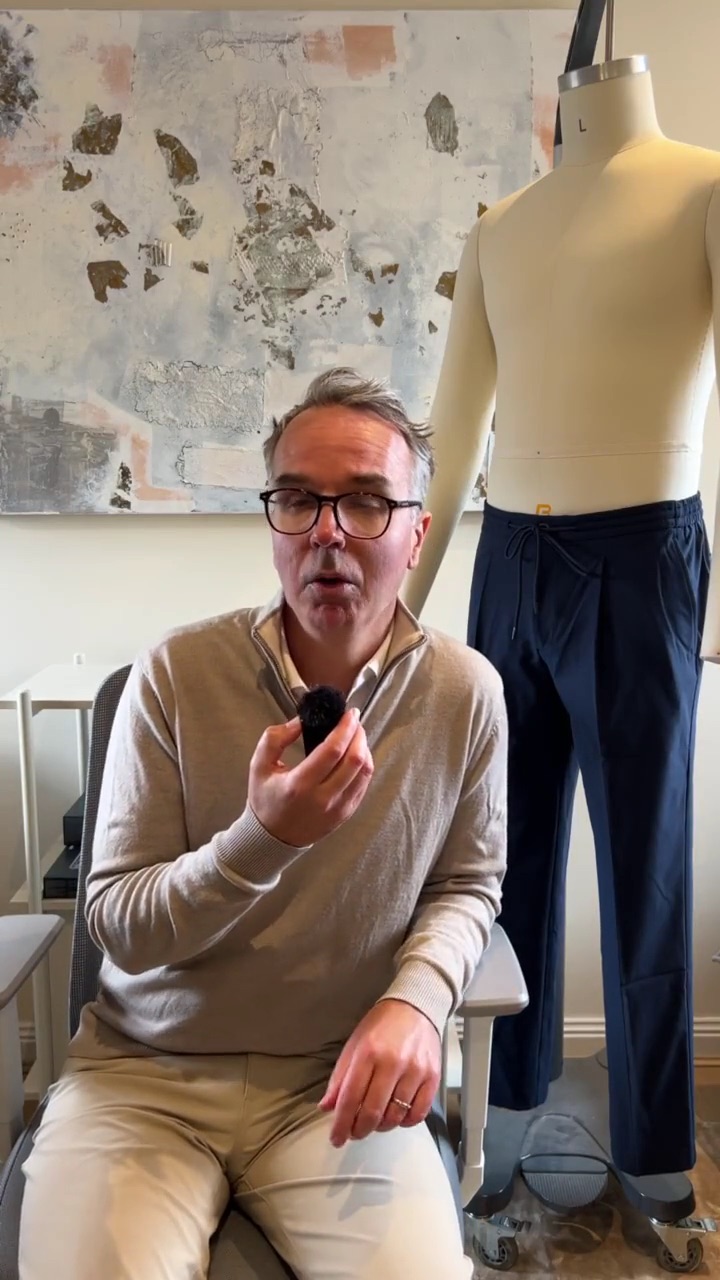
 ABOARD ApparelAlistair Ramsay (Founder) · AU Travel Menswear Brand
+18% conversion rate from a homepage rebuild
 Seat Cover SolutionsArny Pollack (Head of Growth) · 8-figure US Car Equipment Brand
Homepage category navigation doubled conversion rate
 Madd GearGlen Gordon (Head of AU&NZ) · 9-figure Skate Equipment Brand
+18% revenue per visitor from bigger product-page images
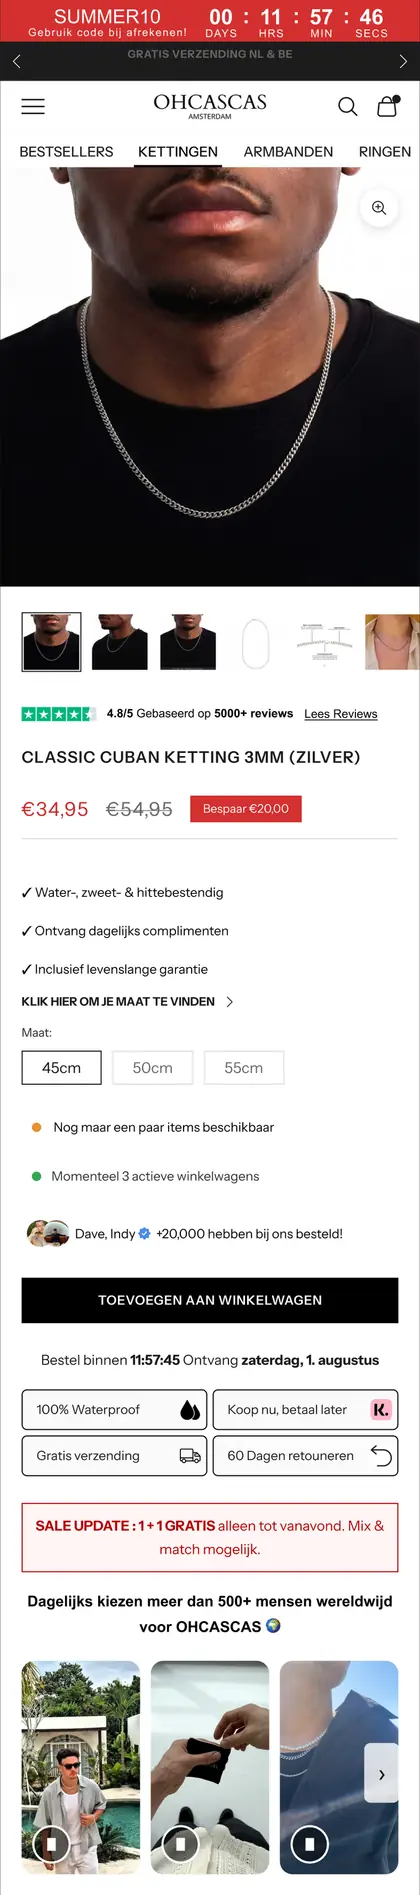
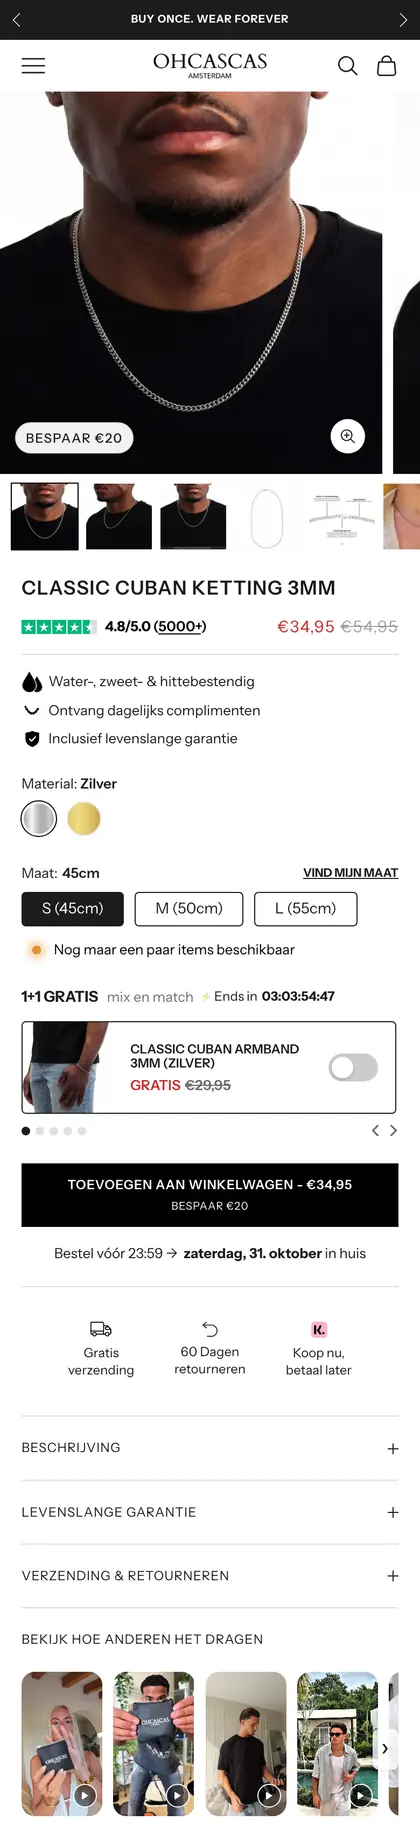
 Botanical H2ODanielle Dale Fraser · 8-figure AU Jewelry Brand
CLIENT WORK
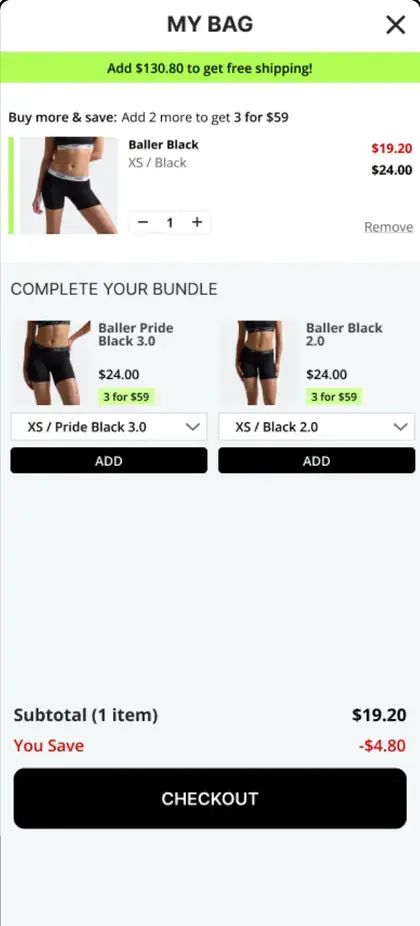
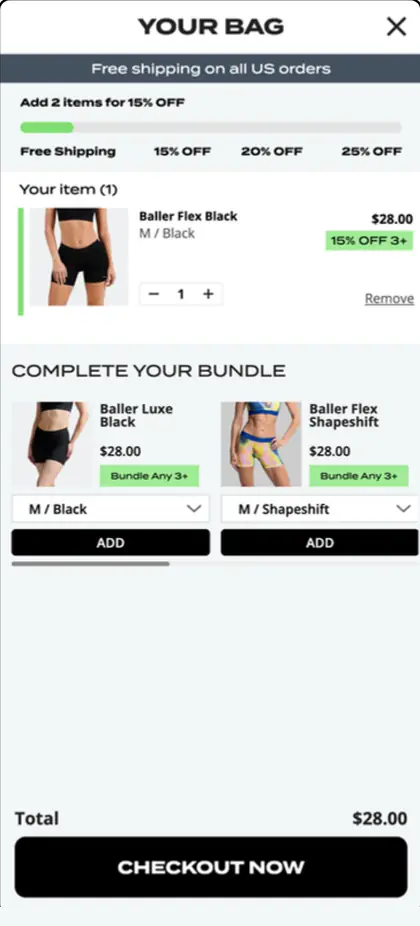
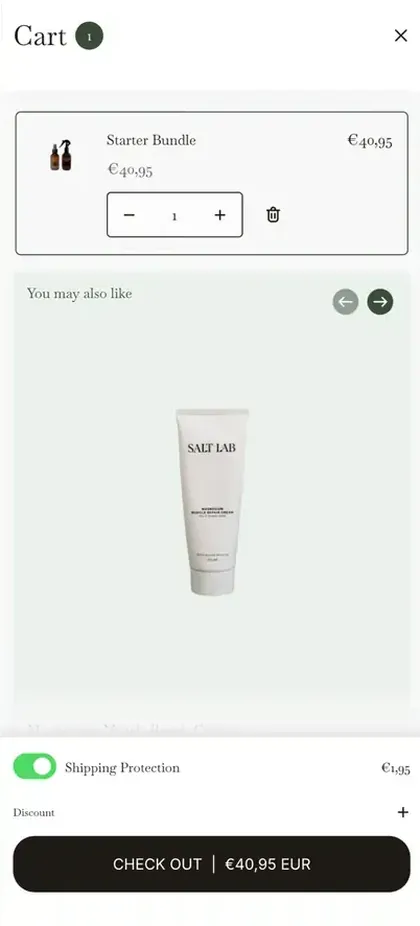
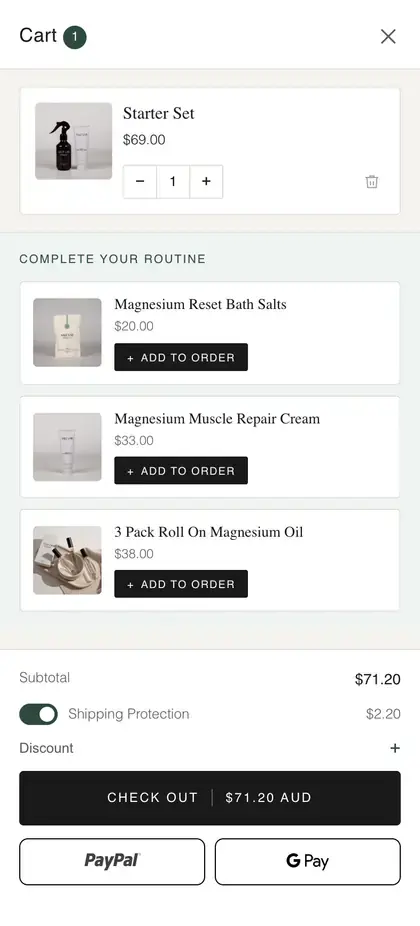
Live storefronts we rebuilt and tested — each one with what it actually moved.


A higher conversion rate on a lower basket is a bad trade. We test for revenue per visitor, so the two move together.
~6,000 visitors per arm · statistically significant at 95% confidence
| Metric | Control | Variation. 2 | Lift | |
|---|---|---|---|---|
| Revenue per visitor | AU$5.46 | AU$6.92 | +26.8% | |
| Conversion rate | 2.74% | 3.36% | +22.6% | |
| Checkout start rate | 3.79% | 4.46% | +17.7% | |
| Average order value | AU$194.71 | AU$203.30 | +4.4% |
Projected impact: AU$64,000 in additional revenue per month, on the same traffic.
Winning A/B tests from client stores. Client names are hidden; the figures are as reported.


FAQ
A single page redesign goes live in 7–10 business days. On the retainer you’ll have tests running inside the first fortnight and a clean read on the first of them within three to four weeks.
Less than most people think. Each version of a page needs roughly 500 visits and 20 orders inside the test window on a smaller store, and around 2,500 visits and 100 orders on a larger one. Most brands doing $50K a month or more clear that comfortably.
Above that line, what decides a test is how big the change is. That’s the part we control, which is why we test bold page rebuilds rather than button colours.
We stop it, keep your original page live, and write down what it taught us. A losing test still tells you what your customers don’t respond to, and that shapes the next one. Catching a loser before it ships is part of the job: it’s revenue you would otherwise have lost by rolling the change out untested.
Mostly Shopify and Shopify Plus, where we run tests in Elevate. For other platforms we test with Varify or VWO.
Lars does. He runs the research, the test roadmap and the page designs on every account, and a senior developer builds them. You speak to Lars directly on Slack, not through an account manager.
A single page redesign is a one-off project with no ongoing contract. Full-funnel CRO runs for an initial 90 days, then month to month.
Yes. We regularly hand designs to a client’s own developer and work alongside their paid-media agency. We agree who builds what on the first call.
FREE · 45 MINUTES
We look at your funnel, name the biggest leak, and tell you what we would test first — whether or not you end up hiring us.
See if you qualify Working with 40+ DTC brands · Founder-led · Typical reply within one business day